Unlock Growth with dPOS Reports. Mastering dPOS reports and Business Insights.
24TH JUN 2024
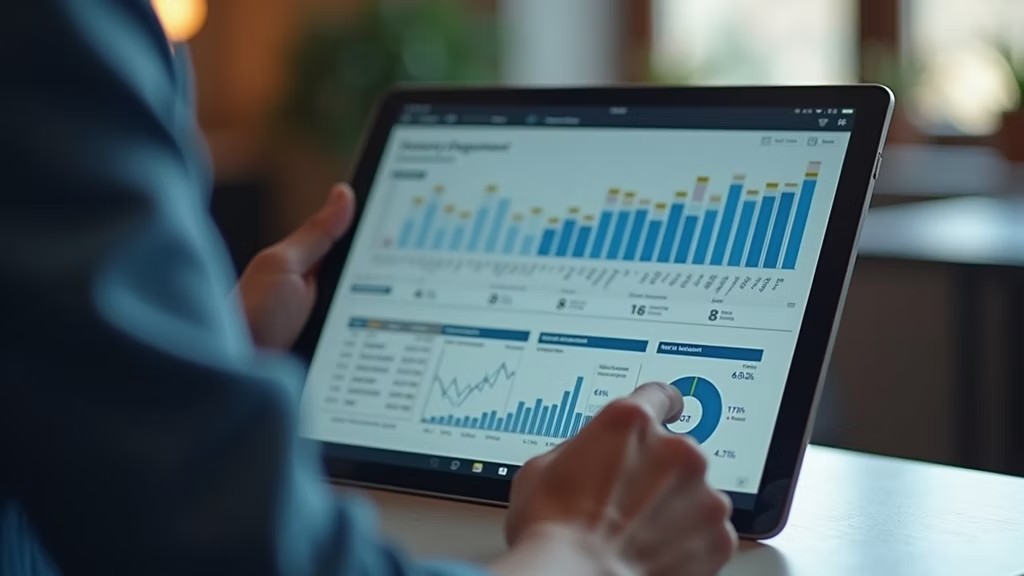
Every business owner wants to grow, but growth requires more than just hard work and good products. It demands a clear understanding of what drives sales, customer behavior, and operational efficiency. dPOS systems generate a wealth of data through business reports. Learning how to read these reports can transform raw numbers into actionable insights that fuel growth.
Understanding dPOS Reports and Their Value
dPOS reports collect data from every transaction, inventory update, and customer interaction. These reports provide a detailed snapshot of your business performance, including:
● Sales by product or category
● Peak sales hours and days
● Customer purchase patterns
● Inventory levels and turnover rates
● Employee performance metrics
By regularly reviewing these reports, you gain a clear picture of what works and what needs improvement. This clarity helps you focus resources on profitable areas and address weaknesses before they become bigger problems.
How to Read Key dPOS Reports
Sales Reports
Sales reports show which products or services generate the most revenue. Look for:
● Top-selling items
● Slow-moving products
● Sales trends over days, weeks, or months
For example, if a particular product sells well on weekends but not weekdays, you might adjust staffing or promotions accordingly. If some items rarely sell, consider discounting or removing them to free up inventory space.
Customer Reports
Customer reports reveal buying habits and preferences. They can show:
● Repeat customers versus one-time buyers
● Average purchase value per customer
● Popular purchase combinations
Tracking repeat customers helps you build loyalty programs or targeted marketing. Understanding average purchase value guides pricing and upselling strategies.
Inventory Reports
Inventory reports track stock levels and turnover rates. Key points to watch:
● Items frequently out of stock
● Overstocked products tying up cash flow
● Seasonal inventory changes
For instance, if a product runs out often, you might increase reorder quantities or find faster suppliers. Overstocked items may need promotions to clear space.
Employee Performance Reports
These reports measure sales by employee, transaction speed, and customer feedback. Use this data to:
● Reward top performers
● Identify training needs
● Balance workloads during busy times
Recognizing strong employees boosts morale, while addressing weaknesses improves overall service quality.
Tracking Trends to Spot Opportunities
Regularly analyzing dPOS reports helps you spot trends early. For example:
● Rising sales of a new product category suggest expanding that line.
● Increased sales during specific hours can guide staffing schedules.
Use trend data to test new ideas, such as limited-time offers or product bundles, and measure their impact through subsequent reports.
Using dPOS Reports to Drive Growth
dPOS reports go beyond basic reports by combining data points to reveal deeper insights. Here’s how to use analytics for growth:
● Identify peak sales periods to optimize staff scheduling and reduce labor costs.
● Analyze customer segments to tailor marketing campaigns and promotions.
● Monitor product performance to adjust pricing or discontinue underperforming items.
● Track inventory turnover to improve cash flow and reduce waste.
● Evaluate employee sales patterns to improve training and incentives.
For example, a café owner might discover that morning sales spike on weekdays but slow on weekends. Using this insight, they could introduce weekend brunch specials and adjust staff hours accordingly.
Practical Steps on how to use dPOS Reports
1. Set a regular review schedule. Weekly or monthly reviews keep you informed without overwhelming you.
2. Focus on key metrics. Start with sales, inventory, and customer reports before exploring more detailed data.
3. Ask questions. When numbers change, investigate why. Talk to staff or customers for context.
4. Take action. Use insights to make small changes, then track results in the next report.
Final Thoughts on Growing with dPOS Reports
dPOS reports provide a powerful way to understand your business deeply. By learning to read these reports, track trends, and apply insights, you can make smarter decisions that lead to steady growth. Start small, stay consistent, and use data to guide your next steps. Your business will become more responsive, efficient, and customer-focused.
Share with your community!
In this article
February 13, 2026
Unlocking better insights: How BI 360 reports transform your understanding of sales, purchases, and product trends
November 28, 2025
Unlock Growth with dPOS Reports. Mastering dPOS reports and Business Insights.
October 28, 2025
Revolutionizing Stock Control in Kenya and How dPOS Fixes Broken Inventory Management
September 19, 2025
Essential Guide to Choosing the Best POS System in Kenya with dPOS Review.
August 15, 2025
The Real Cost of Ignoring VAT Compliance — And How dPOS Solves It
August 7, 2025
Understanding the PoS System
August 1, 2025
dPOS: The Local Solution for Kenyan Retailers
Related Articles

Martin Orlando
24TH JUNE 2024
Unlocking better insights: How BI 360 reports transform your understanding of sales, purchases, and product trends
VIEW MORE
Martin Orlando
24TH JUNE 2024
Revolutionizing Stock Control in Kenya and How dPOS Fixes Broken Inventory Management
VIEW MORE

Martin Orlando
24TH JUNE 2024
Essential Guide to Choosing the Best POS System in Kenya with dPOS Review.
VIEW MORE
Get our latest updates
With lots of unique blocks, you can easily build a page without coding. Build your next landing page.
We’ll never share your details with third parties.
View our Privacy Policy & Terms for more info.
DPOS has been carefully crafted to blend perfectly into your business. You can automate stock control, sales, purchases and so much more.